Unleash Your Efficiency with Our Affiliate Dashboard
- Free 15-Day Trial
- No Developer Needed

Benefits of a Data Aggregation Affiliate Dashboard
Affiliate aggregator and traffic data in one dashboard
Aggregating all your affiliate data in one affiliate dashboard will help you to always be up to date on your affiliate marketing performance without logging into all your affiliate network accounts and putting together reports manually with Excel or Google Sheets. All your affiliate network account data and website data can be collected and attributed automatically and presented in one sophisticated affiliate dashboard. This will help you to easily monitor the performance of all available dimensions.
You can look at your data from all levels:
- advertisers
- affiliate network accounts
- websites
- traffic sources
- landing pages
- campaigns
- status
One Currency & Time Zone
You can select your preferred currency and time zone under Settings > Account. We will then convert all the transactions and dates in your preferred currency and time zone.
Affiliate Conversion Attribution
With our system it is possible to automatically attribute your affiliate conversion data to your traffic data and report it in our affiliate dashboard. This will deliver great insights on how your traffic sources, websites and landing pages are performing, which creates the opportunity to optimise and scale up campaigns.
In order to activate our affiliate conversion attribution feature you will need to connect your website(s) to our system, by placing our JavaScript snippet or installing our WordPress plugin on your website(s). Our system will then place subid parameters within your affiliate URLs by redirecting them through our system or by making use of a hook within the redirect process (of for example cloaking plugins your are already using, such as Pretty Links, Thirsty Affiliates or Redirection).
Customising your Affiliate Dashboard
The advantage of our affiliate dashboard is that it can easily be adjusted. Just let us know what you would like us to change in your dashboard and we will quickly do so.
Export your data in Google Sheets or download it in CSV format
We can also enable an export function for you which will enable you to export all the affiliate network conversion data you selected or filtered in the affiliate dashboard. Once we activated that feature for you, you can hover over a table and click on the three dots which will give you a menu through which you can select whether you want to download the report or export it to Google Sheets.
wecantrack Affiliate Attribution Dashboard Reporting
Our affiliate data aggregation and attribution dashboard delivers an overview of the overall performance of your affiliate websites and network accounts. It combines your session, click and conversion data in order to create full transparency. You will be able to analyse your data on every level to find important insights to improve your content and campaigns.
1. Transaction Filters
By using the transaction filters you can quickly filter out data based on advertisers, network accounts, networks, status or network tags, which will allow you to easily dive deeper into your performance analysis.
The transaction filters will filter the data based on conversions and the corresponding sessions and clicks that led to the conversions
2. Performance Overview Boxes
Always be up to date about your current performance with our Performance Overview Boxes which report conversions, commission, sale amount, clicks, sessions, CTR (Click Through Rate) and ECPC (Earned Commission per Click) of the selected time range, yesterday and today.

The Performance Overview Boxes also compare the performance of the selected time range with the performance of the previous time range.
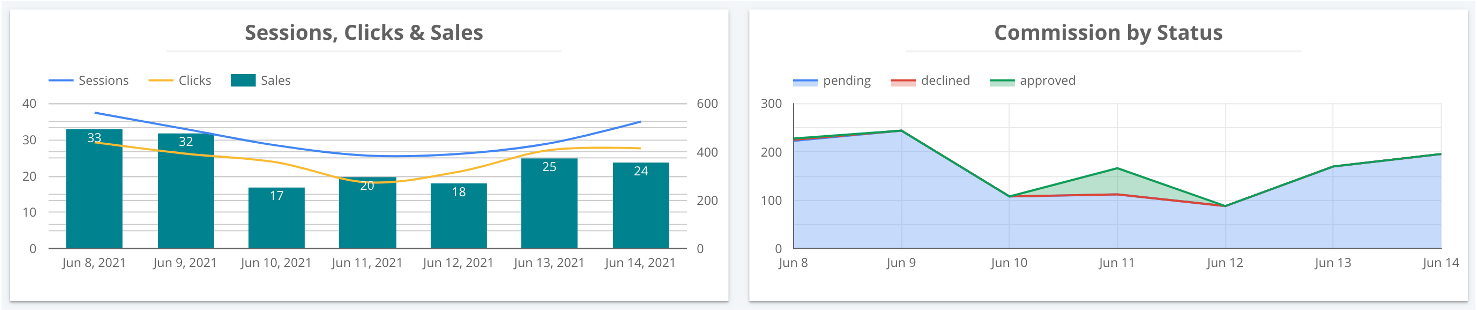
3. Performance Graphs
The Performance Graphs give a visual overview of the sessions, clicks, conversions and commissions (by status) generated in the selected time range.
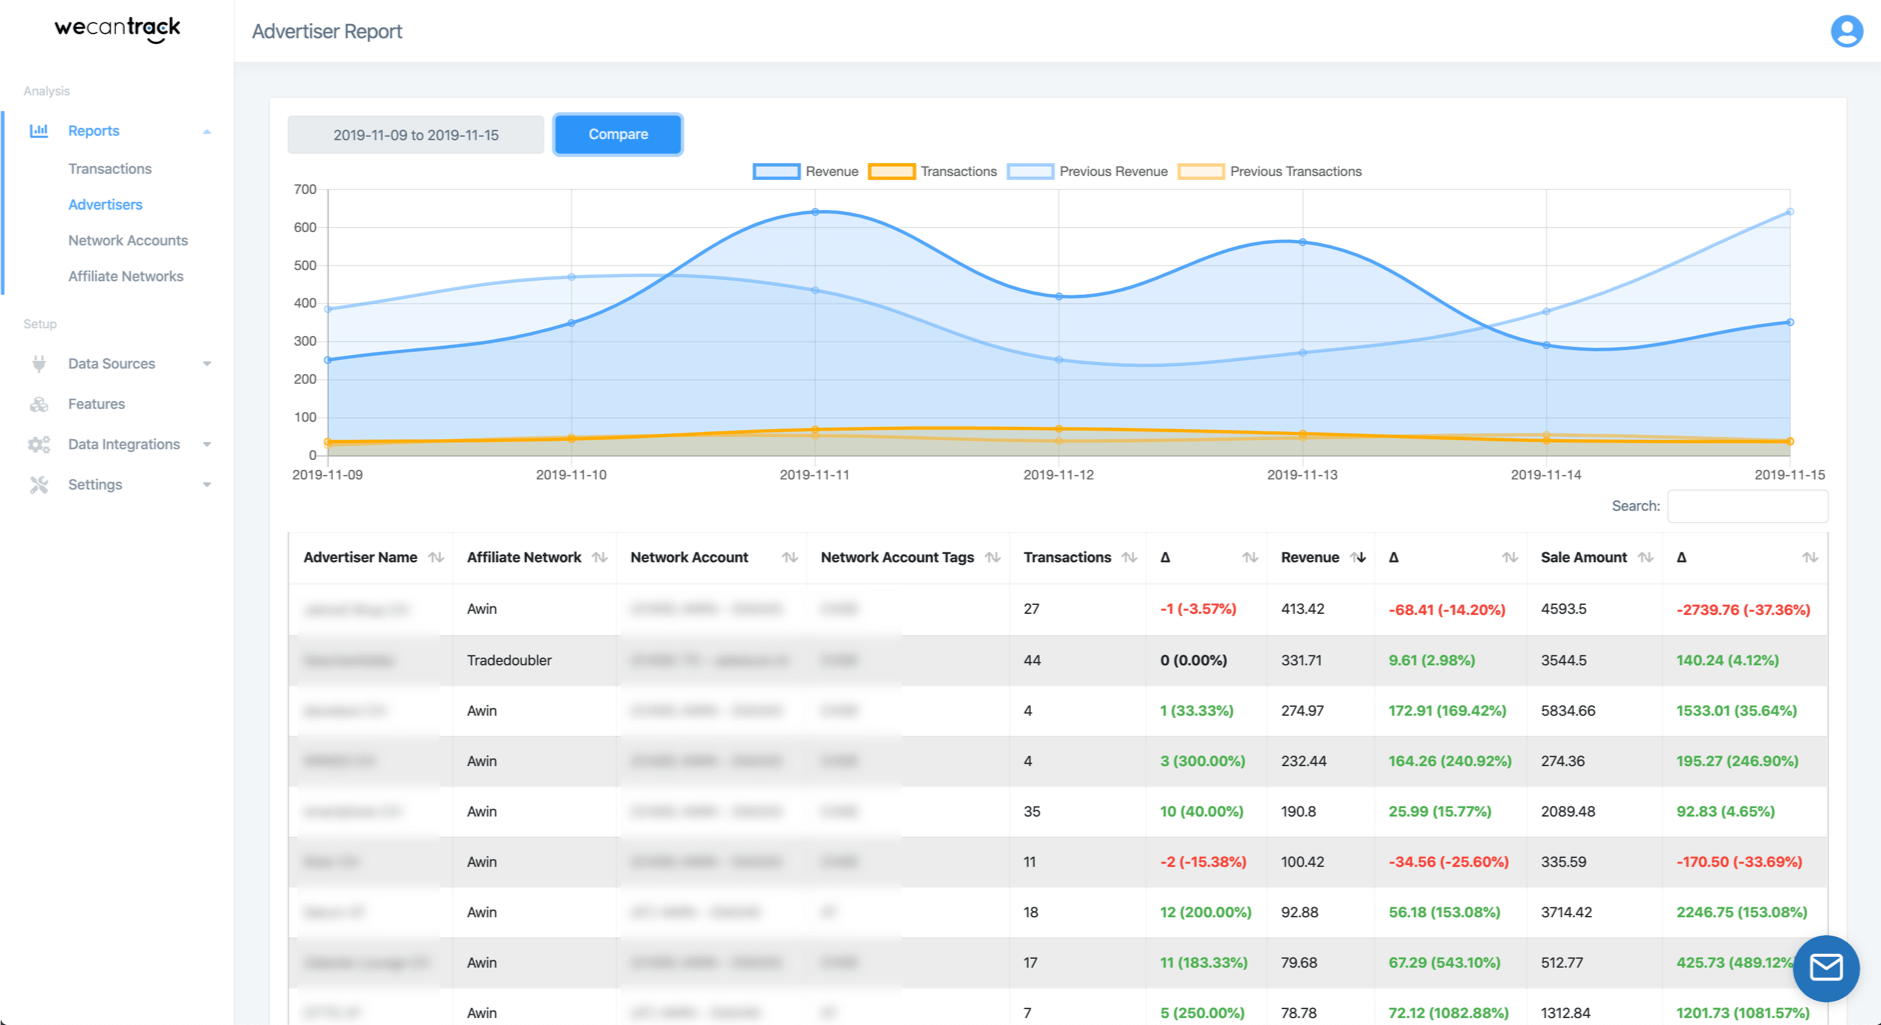
4. Advertiser & Transaction Report
The Advertiser & Transaction Report tables show the advertiser and transaction performance sorted on commission (descending) which helps affiliate publishers to keep an overview with which advertisers they generated the most commission.
The advertiser report compares the current period’s sale and commission performance with pervious period’s performance in order to deliver an overview whether advertiser performance increased or decreased.
5. Affiliate Network & Network Account
Our affiliate dashboard also reports based on affiliate network and network account name, giving you overall performance of your different network accounts. You can also set up tags for your network accounts, in case you for example have one network account per market or website. This will allow you to easily filter the entire dashboard based on the tags.

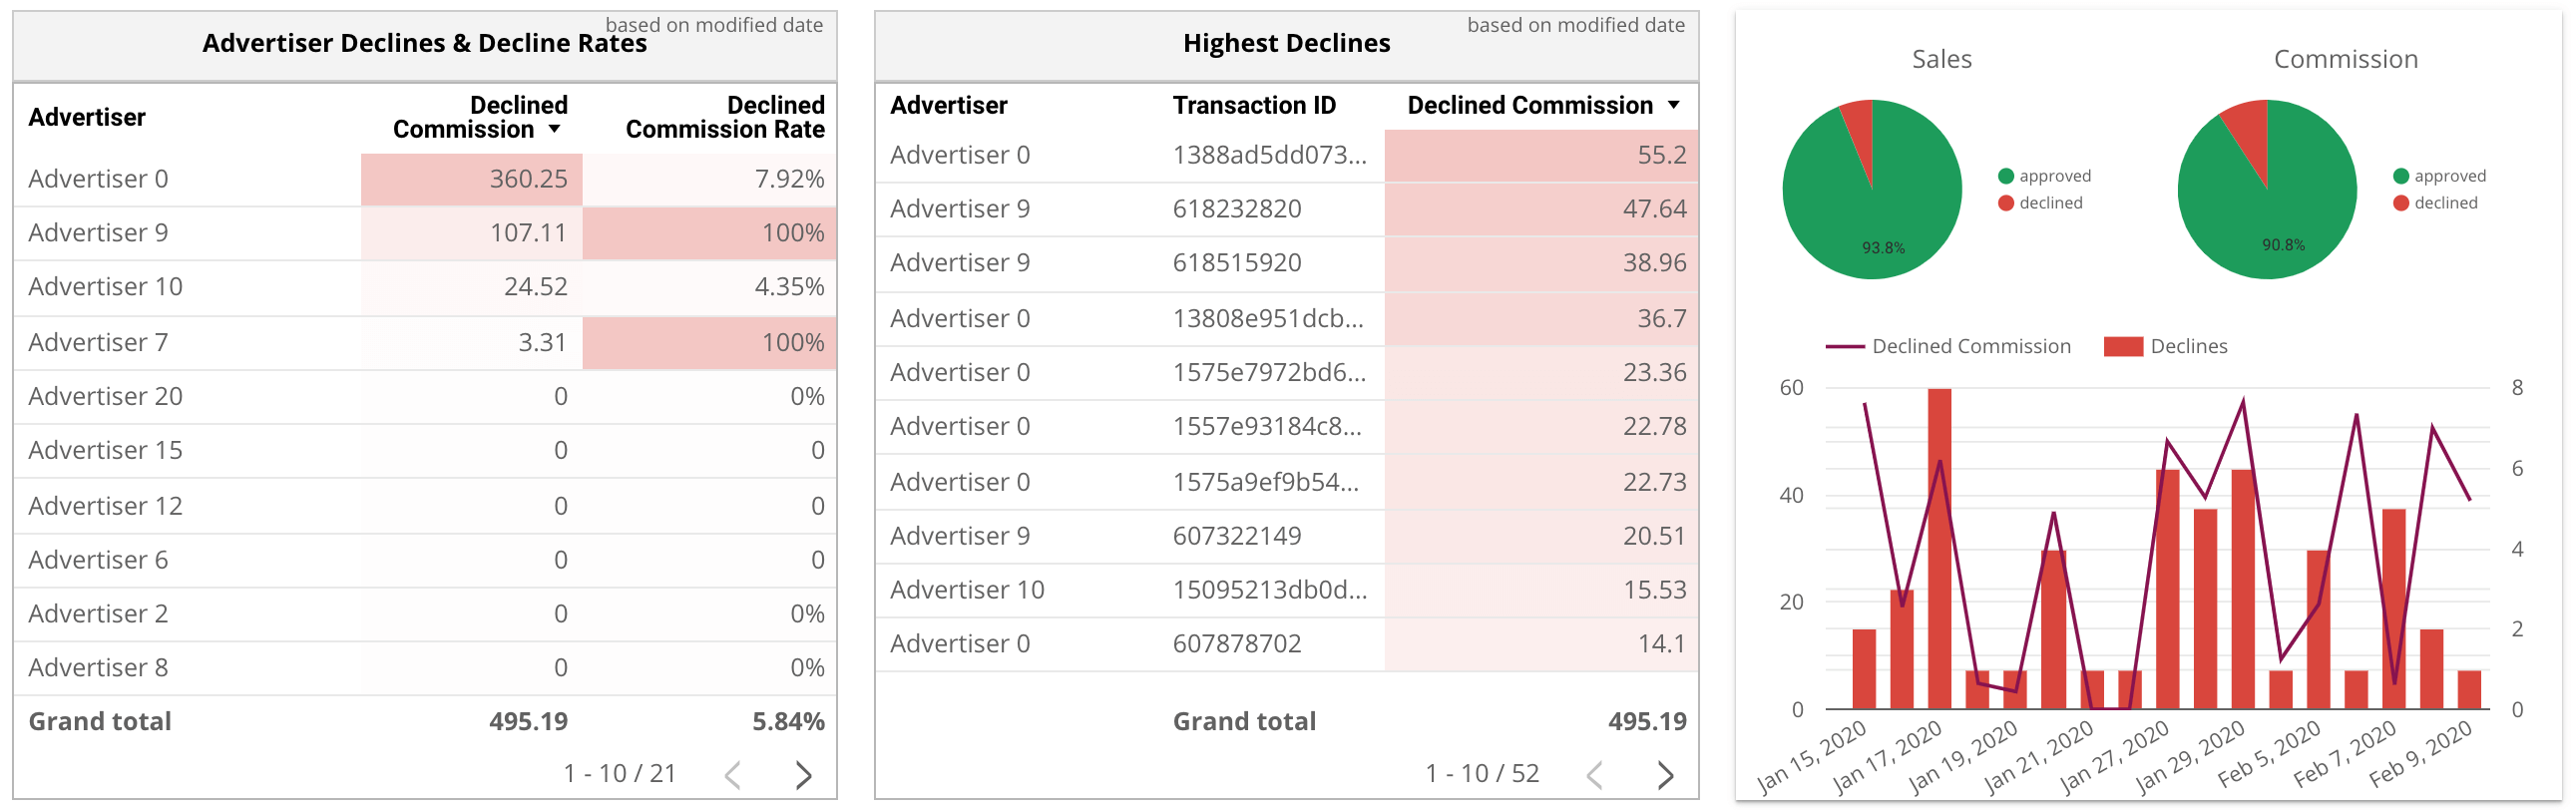
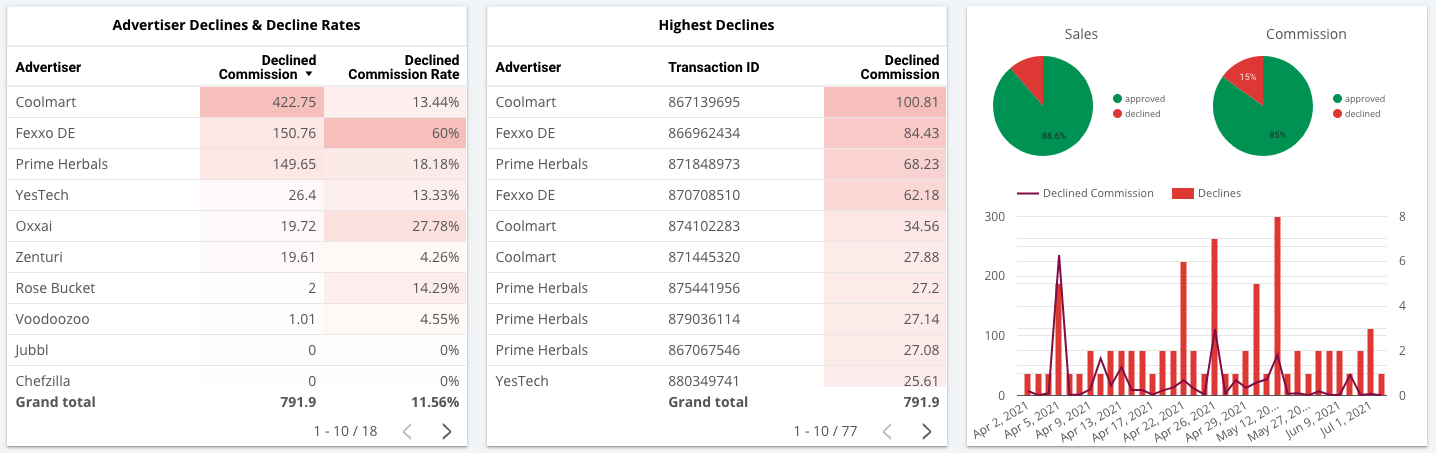
6. Affiliate Conversion Status Update
This dedicated section keeps you informed by alerting you when an advertiser rejects a significant percentage of your sales. It is worth noting that status adjustments often occur months after the initial transaction, and many affiliate publishers tend to overlook monitoring their decline and approval rates accurately.
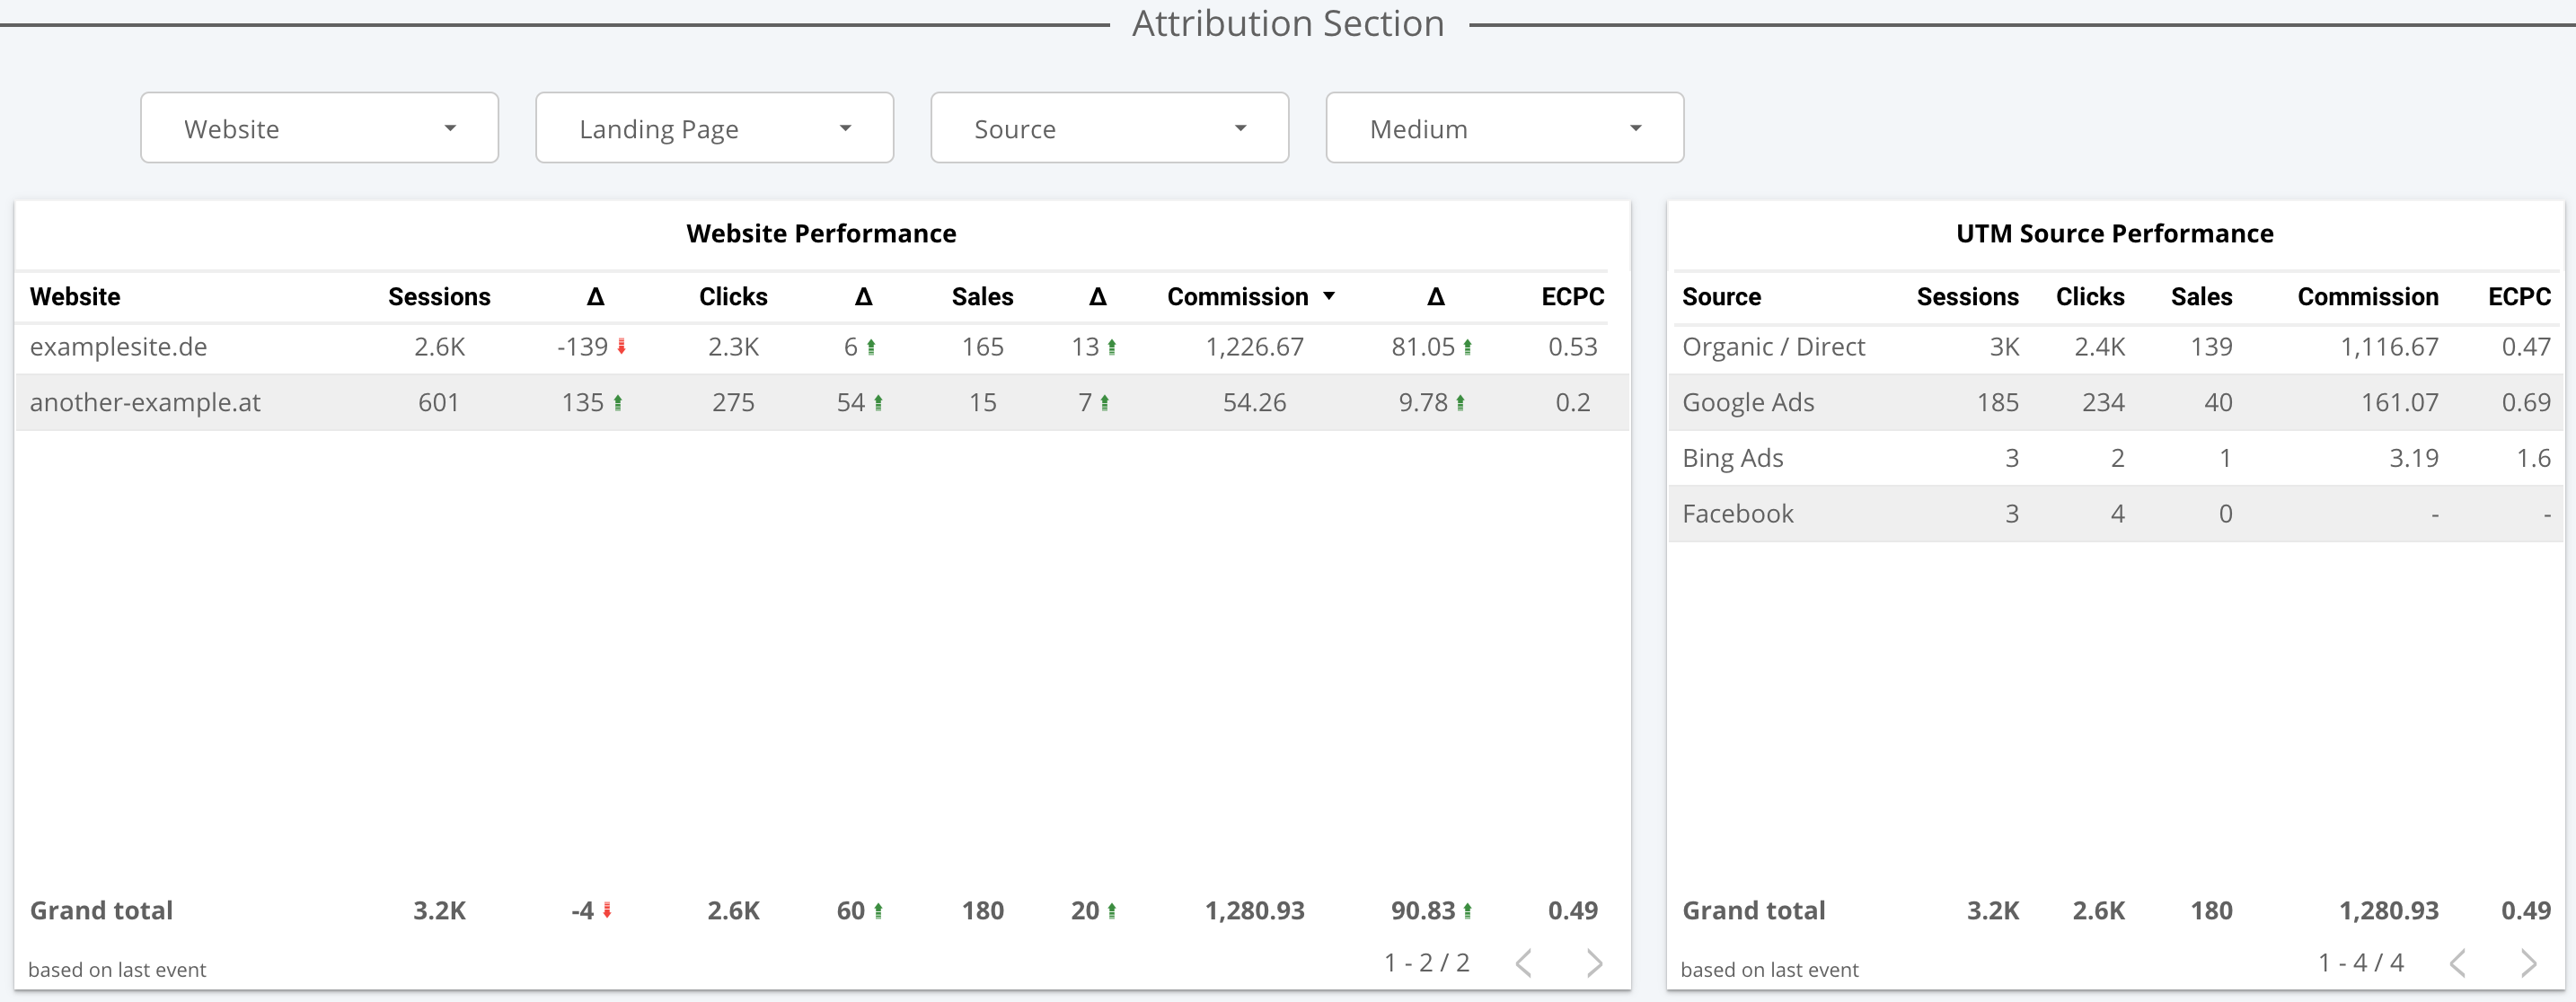
7. Affiliate Website & Traffic Source
Within the attribution section of our affiliate dashboard you can find out the overall performance (sessions, clicks, conversions and commissions) per website and traffic source. By clicking on a website or a traffic source, the entire dashboard will filter on the selected value, allowing you to easily diving deeper into the data. By clicking on the same row again the filter will be undone.
8. Landing Page Report
The affiliate landing page performance report gives you an overview of your best performing landing pages, based on commission value. It includes sessions, CTR, clicks, conversion rate, conversions, commission amount, commission and ECPCs, thus making it easy for you to spot which landing pages are performing well and which could perform better. Please keep in mind that this table reports pages the users landed on, not necessarily where they clicked out.
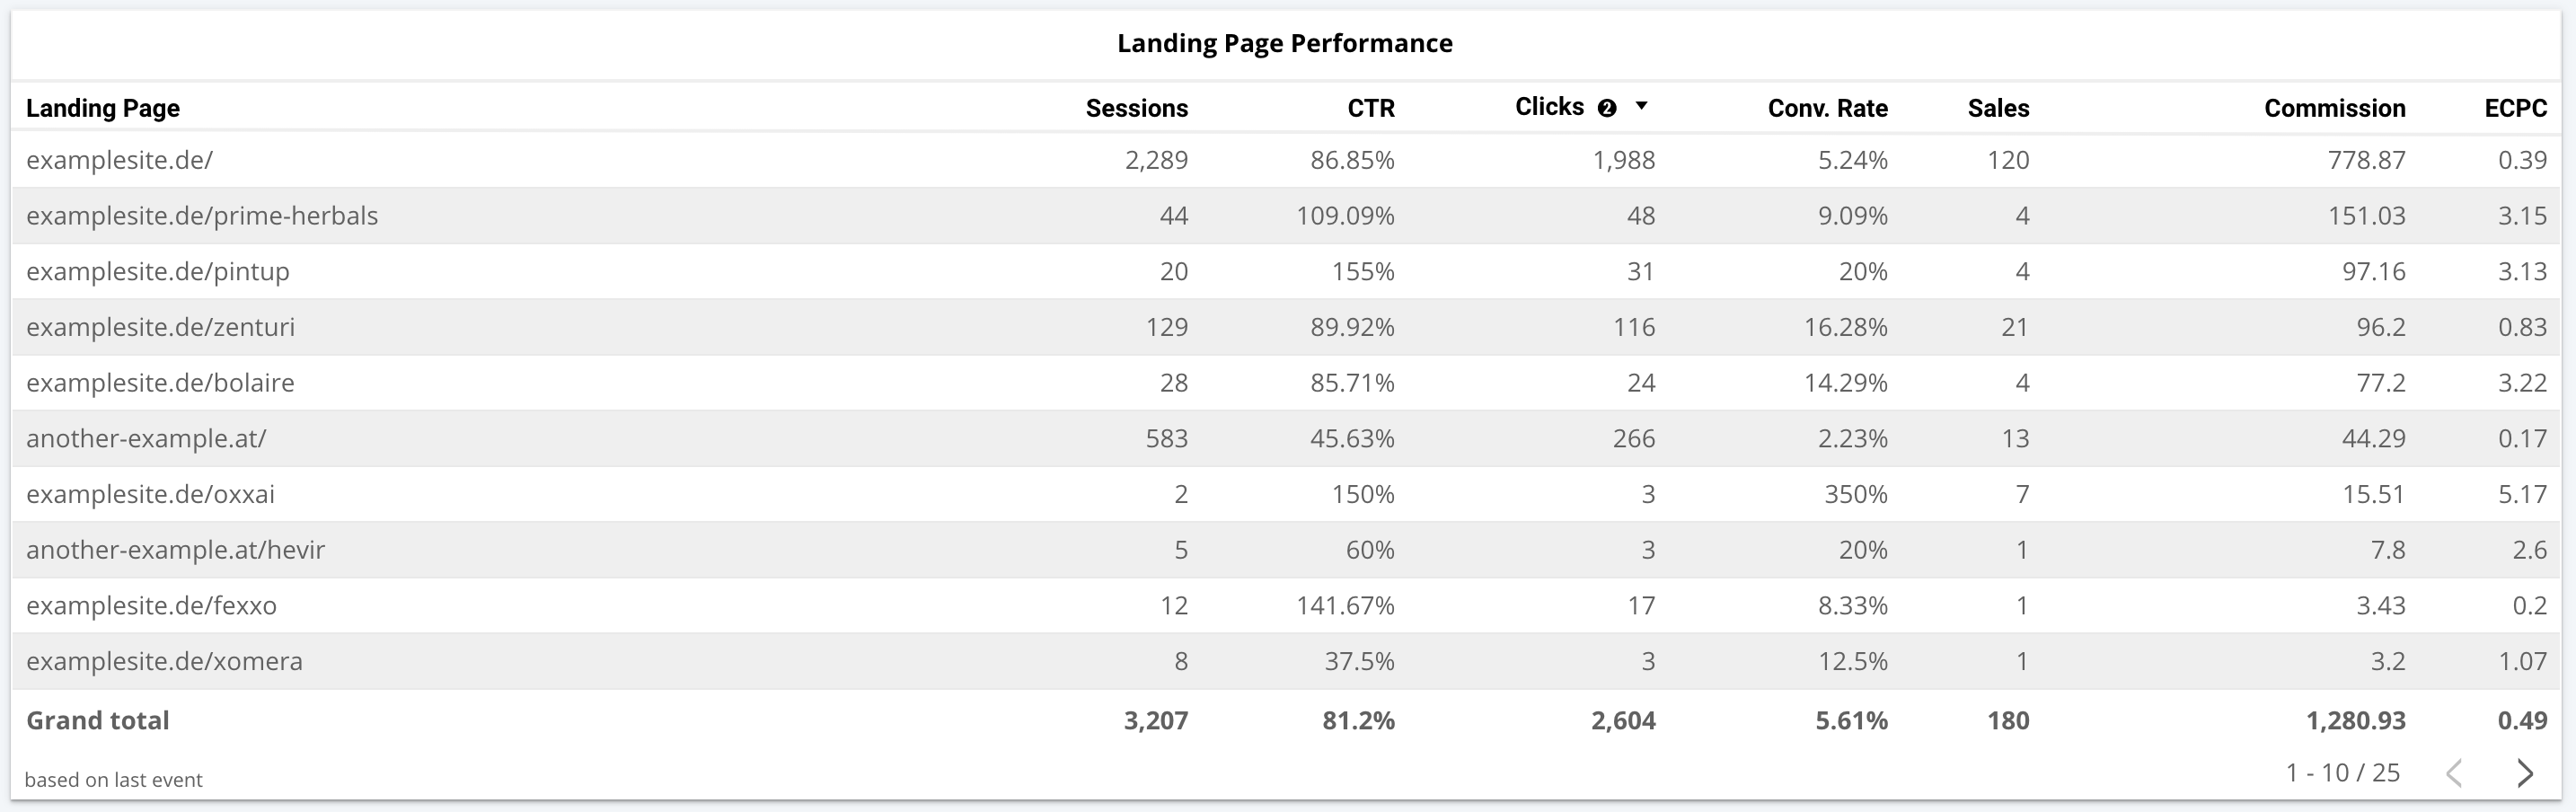
By clicking on a row you can filter the dashboard on one specific landing page which will deliver further insights on e.g. to which click pages the user went from the landing page and which affiliate links they used.
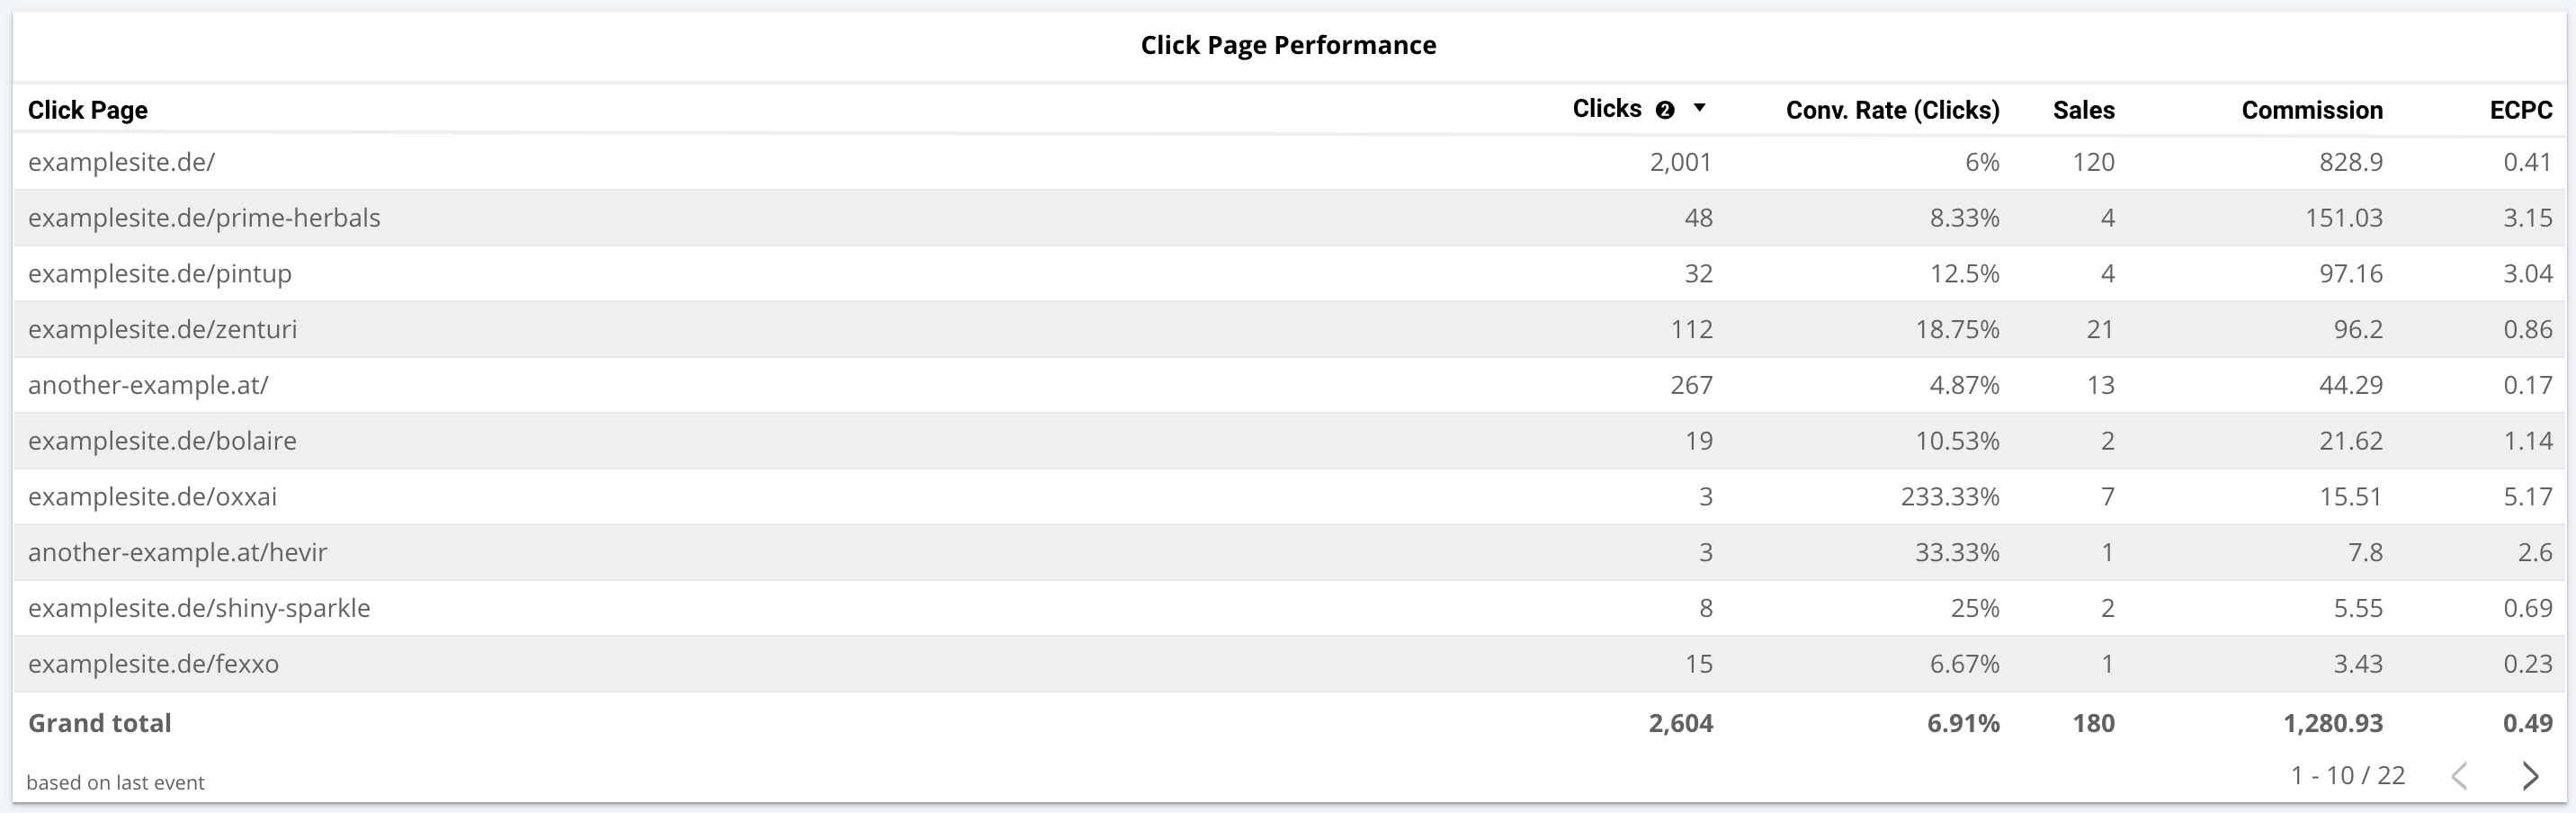
9. Click Page Report
The affiliate click page performance report delivers insights on the performance of the pages where the click outs occur. It reports clicks, conversion rate, conversions, commission and ECPCs and will help you identify which pages perform well and which don’t.
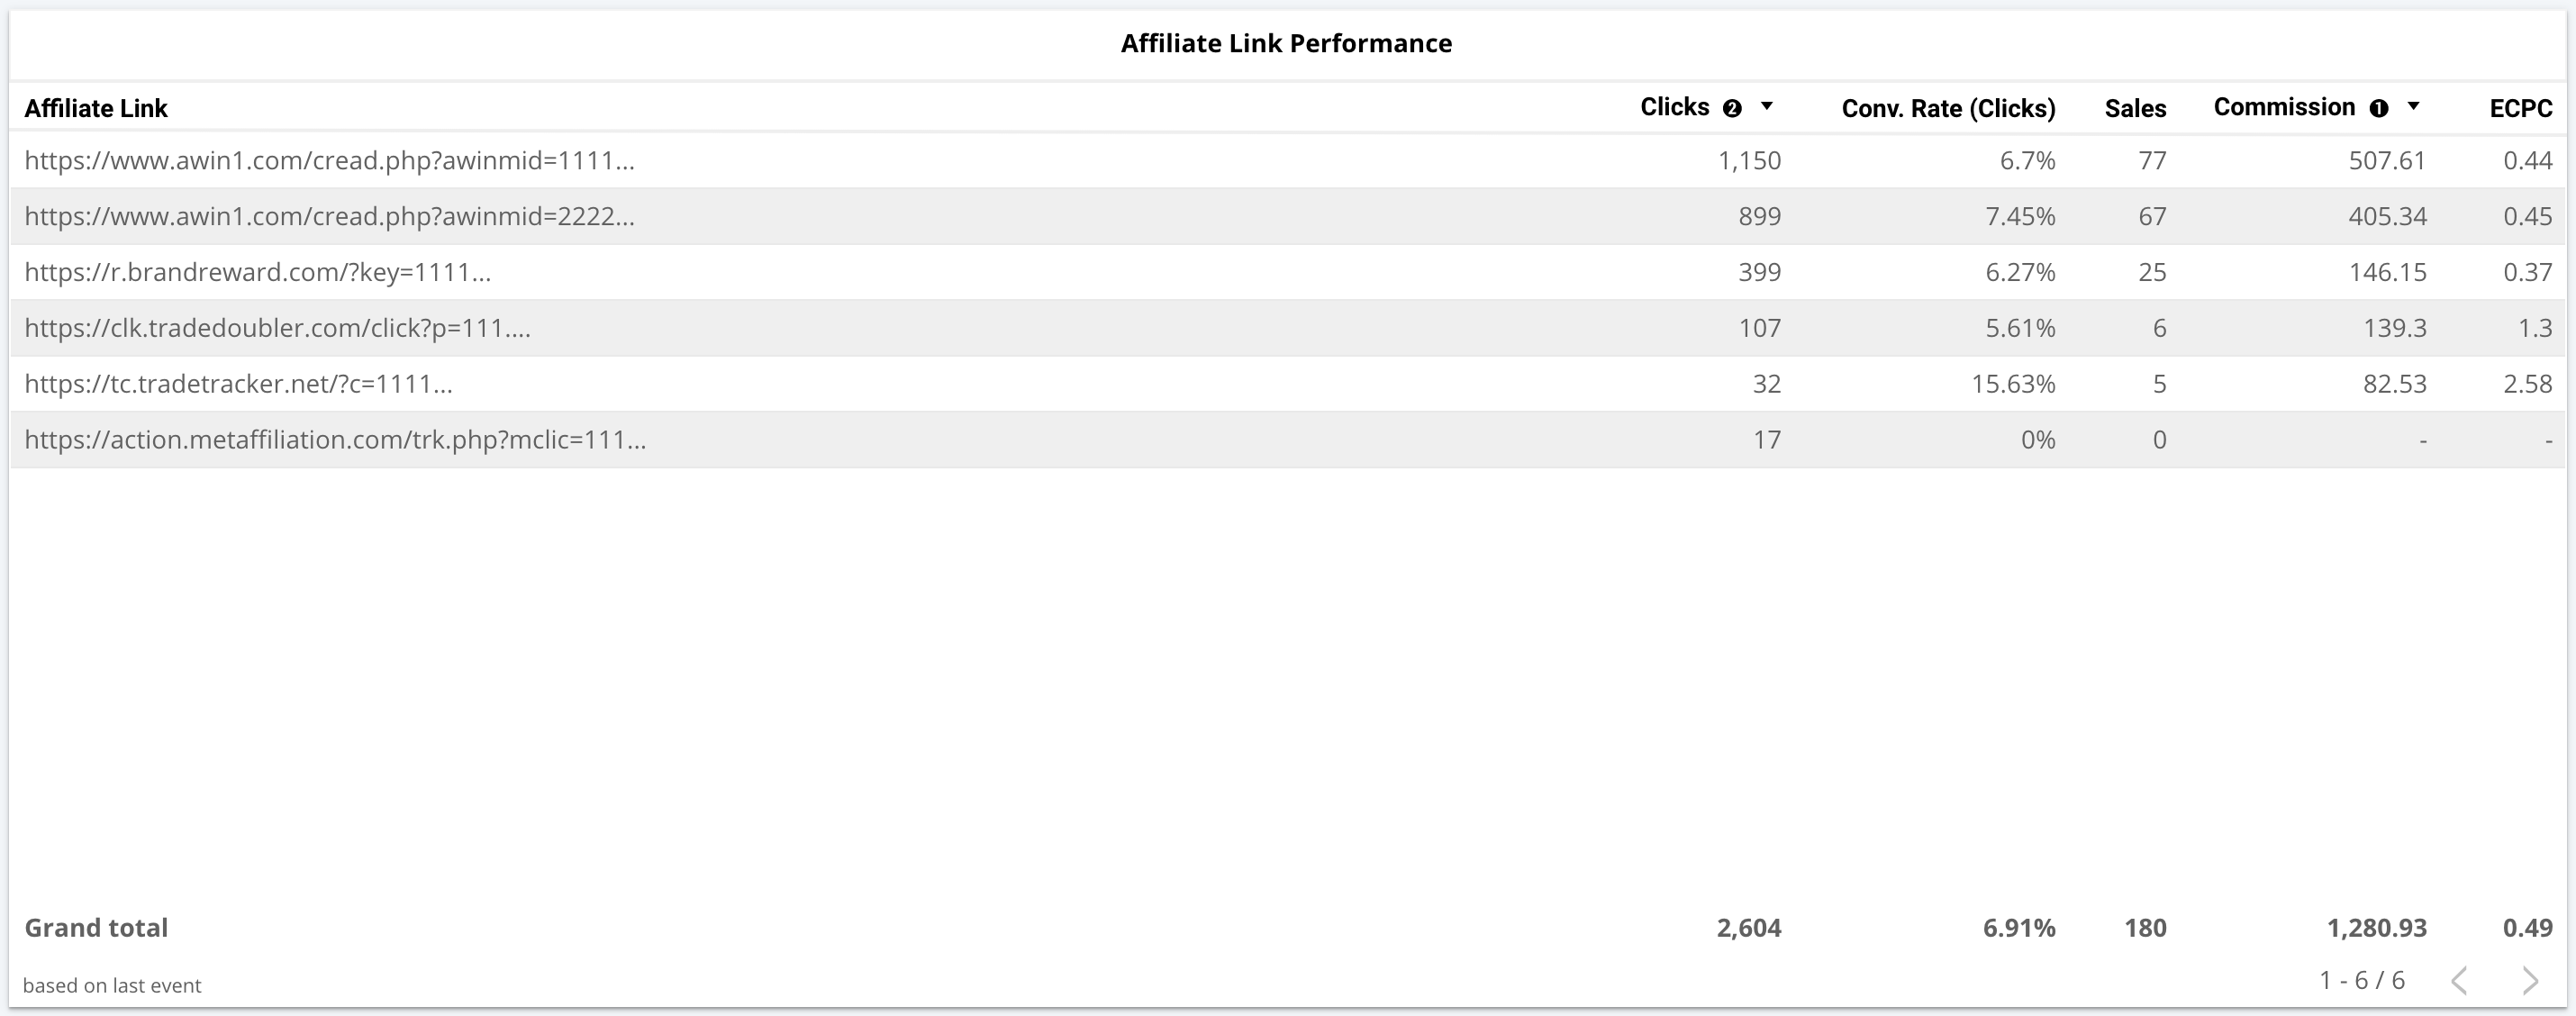
10. Affiliate Link Report
In order for you to easily spot which affiliate links are performing the best our affiliate dashboard also gives you an overview of affiliate link performance. Especially after filtering the dashboard on landing page or click page level, this report can be very helpful.
How to set up a Data Aggregation Affiliate Dashboard
Setting up our data aggregation affiliate dashboard is very simple and only requires you to follow two steps:
In the affiliate network forms on our platform you will find detailed descriptions on where you can find your API credentials.
How the Data Aggregation Affiliate Dashboard works
Once you have added your affiliate network accounts to our system by providing the necessary API credentials, we will automatically fetch your affiliate conversion data from multiple affiliate networks and process the data in order to aggregate the data and report it to you. The data collection happens close to real-time, our dashboard will only update once every hour though. If you want your data to be updated more frequently, please contact us and we can arrange a custom solution for you.
Additional Information about our Affiliate Dashboard
Aggregating your conversion data from multiple data sources can be a game changer. It carries a lot of benefits and going the extra step of data attribution will give you total transparency over your data and performance.
SAVE TIME
By having all your affiliate network data in one dashboard you can save a lot of time since you no longer need to log into every affiliate network account to check out your sales performance. We report your data in multiple preset reports: Transactions, Advertisers, Network Accounts and Affiliate Networks. Moreover, our Affiliate Dashboard contains all reports in one and also gives an overview about status changes.
Simply select the time range and our report will immediately show you your sales data. When you integrate a network account, we get the data of the last 2 months (in case it is possible). If you’d like us to collect more historic data, please get in contact with us.
COMPARE PERFORMANCES
With the click of one button you can compare your sales data with the previous period (if you selected last 7 days it will be compared with the 7 days before). This way you can quickly identify which of your advertisers are underperforming and which ones generated more sales or commission in your selected period. You can easily sort on the changes by clicking on the titles of the columns.
To remove the delta columns, simply click on the compare button again.
ALWAYS BE UP TO DATE
Use our platform to always be up to date about your performance. Not only about historic data, but also about today’s sales!
We are as close to real time data as possible. We make sure that once the sales data is reported in the affiliate networks, it is included in our reports. This way you can use our platform to quickly check your sales performance each day.
BE AWARE OF DECLINE RATES
Get informed about newly registered declines, warning you if an advertiser declined a high percentage of your sales. Since the status is usually being adjusted after months, many affiliate publishers do not properly keep track of their decline and approval rates.