

Tracking Affiliate Sales and Lead Conversions in Data Studio
Streamline Affiliate Reporting With Google Data Studio Integration
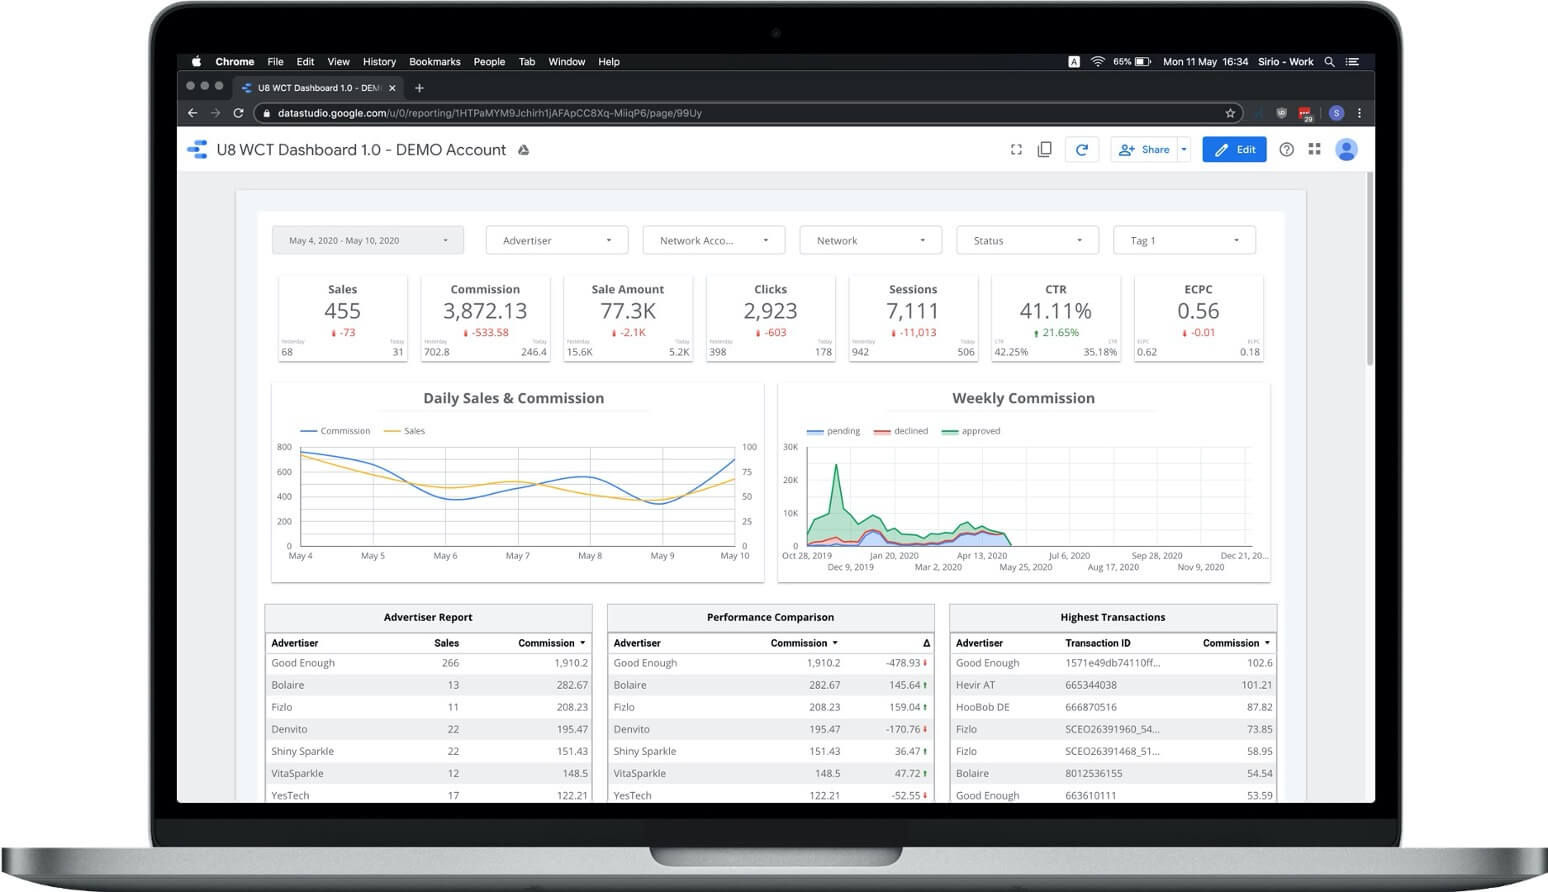
Track and integrate all your affiliate conversion and traffic data automatically in Data Studio to build your own dashboards and reports containing all the relevant data you need.
- Free 15-day trial
- No Developer Needed
Learn About:
Capabilities With Affiliate Conversion Data In Data Studio
Connect All Your Data Sources
Having all your affiliate sales in Data Studio has the great advantage of being able to easily add further data sources to your dashboard. Because of that, you can show all of your most relevant data sets next to each other, giving you and your team a quick and full summary of your current performance.
Besides the 18 standard data sources that Data Studio already provides, numerous partner connectors allow you to connect anything you want to have in your dashboard.
To add a new data source, go to:
Resource – Manage added data sources – Add a data source
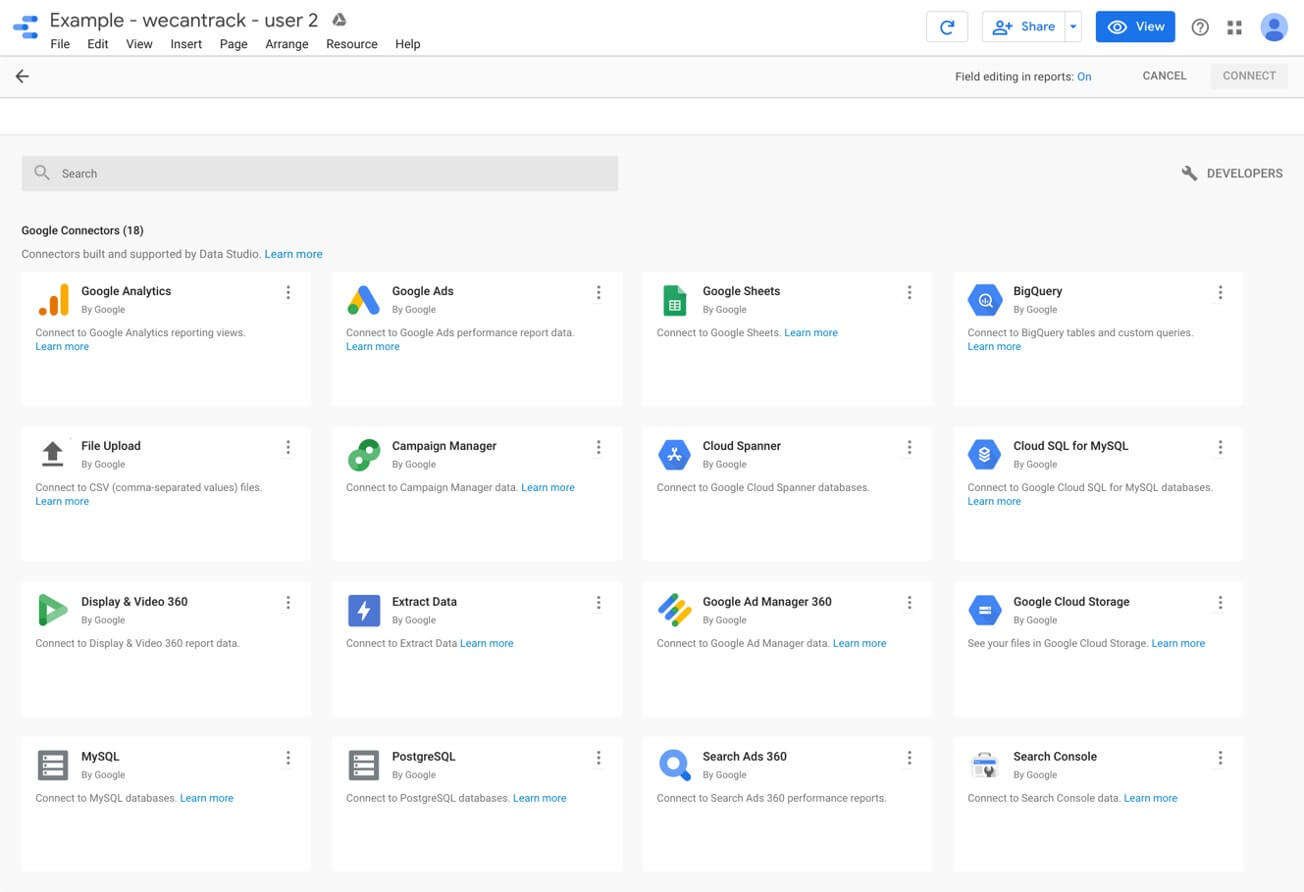
Data Studio’s standard data sources:
- Google Analytics
- Google Ads
- Google Sheets
- BigQuery
- File Upload
- Campaign Manager
- Cloud Spanner
- Cloud SQL for MySQL
- Display & Video 360
- Extract Data
- Google Ad Manager 360
- Google Cloud Storage
- MySQL
- PostgreSQL
- Search Ads 360
- Search Console
- YouTube Analytics
- TV Attribution
Customize Your Dashboard
We offer you to use our Data Studio template but also grant you edit rights, meaning you can customize the dashboard to your needs. Data Studio is very user-friendly, allowing people with no technical background to create beautiful, sophisticated dashboards, graphs, and tables.
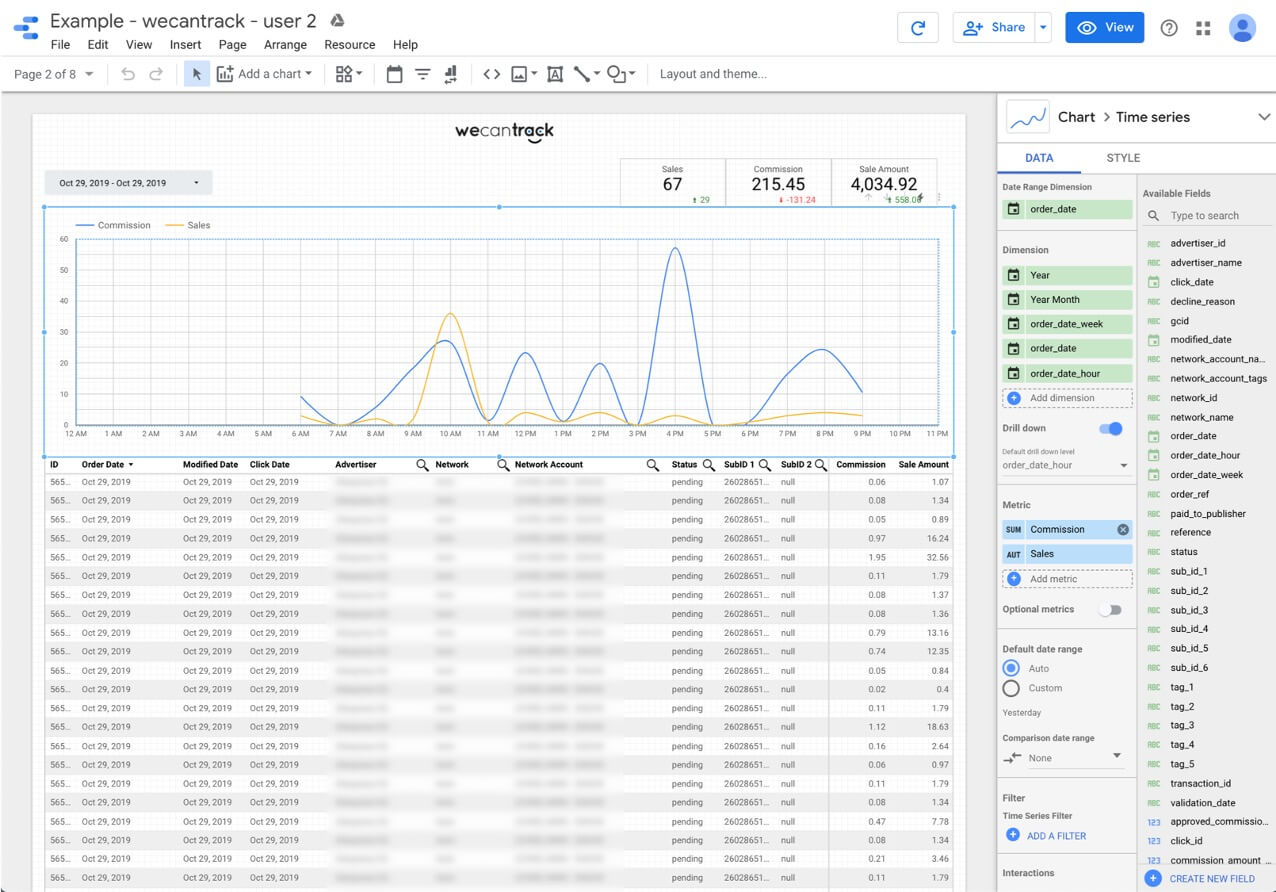
In edit mode, click on a table or graph, and you will immediately get an edit bar that enables you to drag and drop dimensions and metrics into your graph or table.
You can adjust the dimension or metric order and names, date ranges, filters, segments, comparisons and style. It is even possible to quickly add a new metric through a formula (e.g., “commission/sales”).
Filter Out What's Relevant To Grow Your Business
Set up your tables and graphs so that they always highlight the most important aspects. You can decide what data is shown by using filters.
Whether you want to exclude certain transactions or values that exceed or fail to reach a defined amount, what you express in your tables and graphs is up to your creativity and rational thinking.
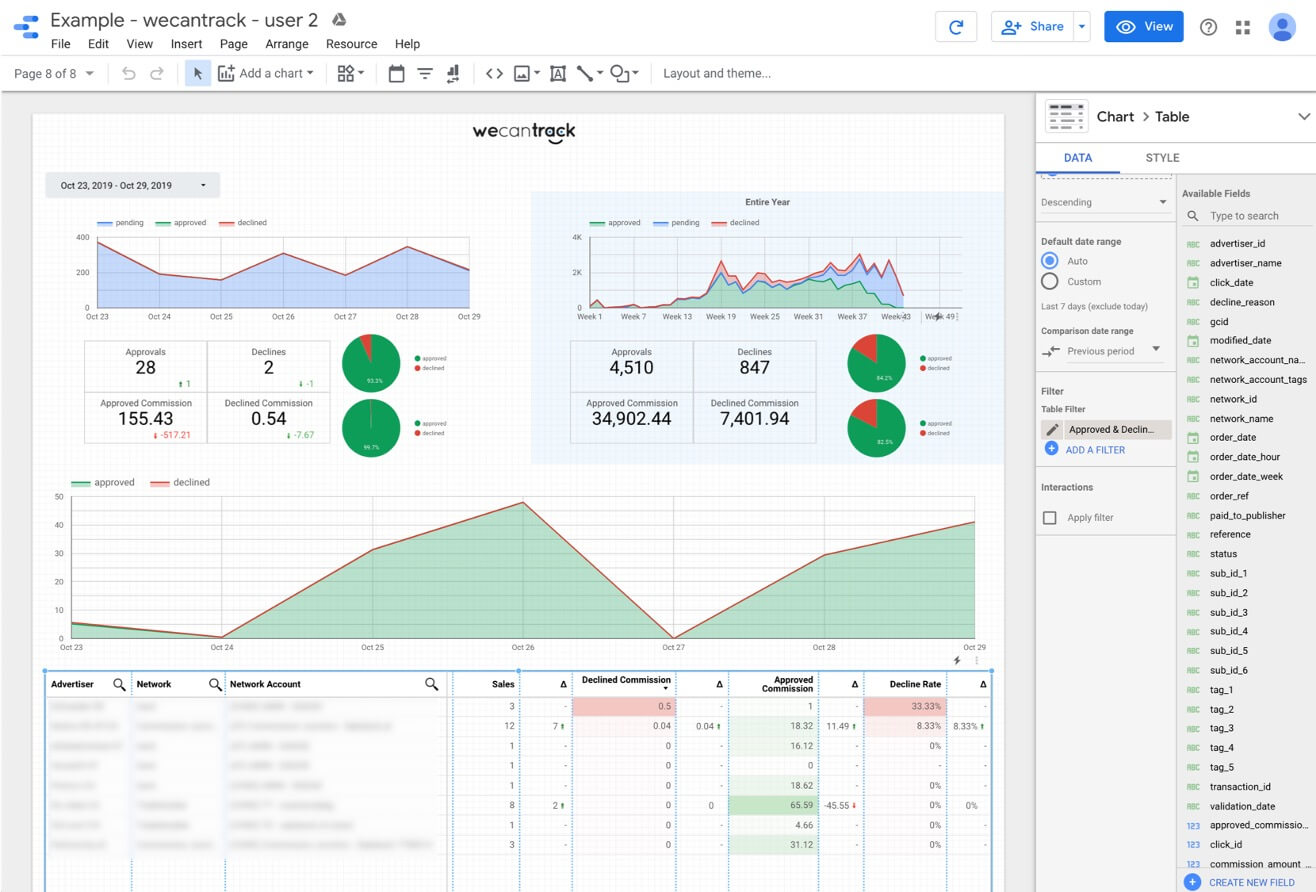
With filters, you can create status reports showing you all the registered declines, for example, yesterday. Thus, you will always be updated about any status changes and decline & approval rates.
Create Your Own Graphs & Reports
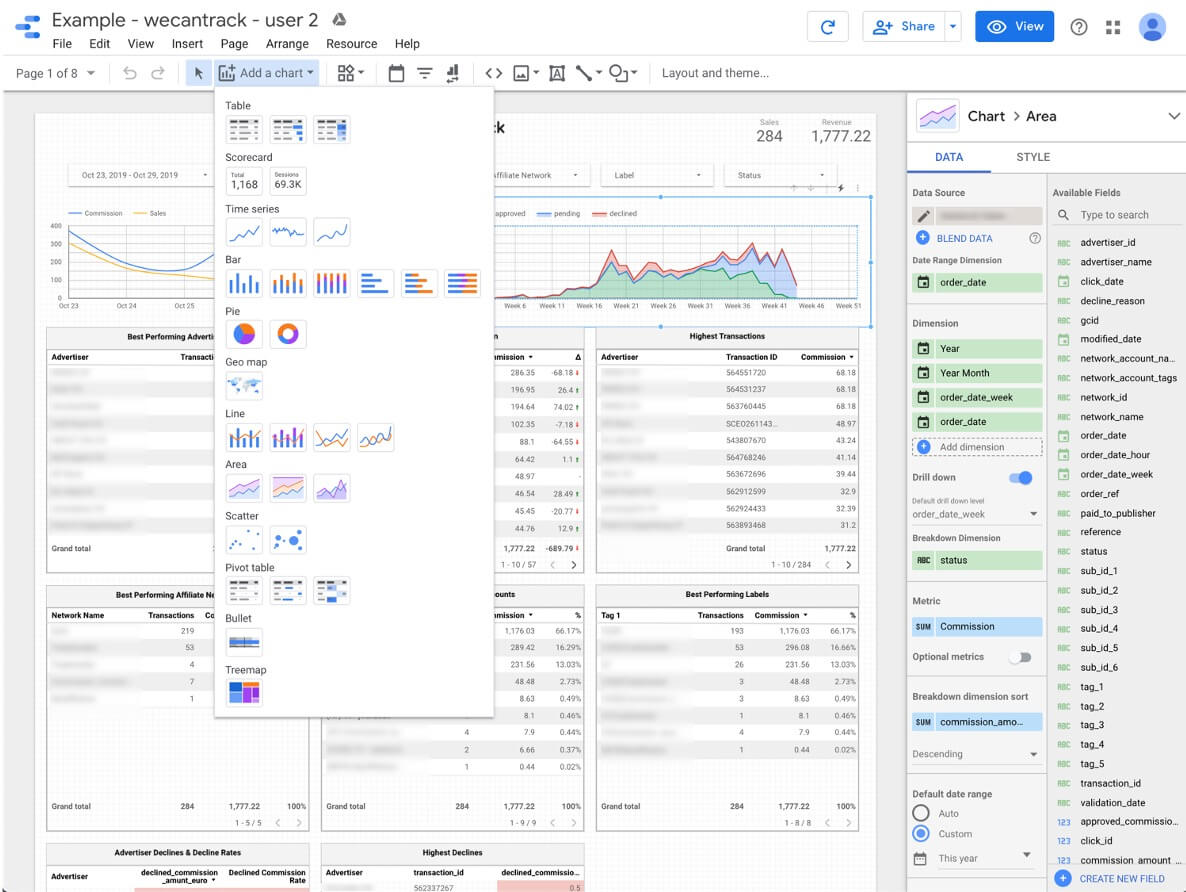
As mentioned before, with Data Studio, it is easy to create reports with neat graphs and tables via drag-and-drop. Simply click on “Add a chart,” select your preferred chart style, and drag-and-drop the dimensions and metrics you wish to report on.
Easily Share Your Reports
If you need to share reports with your colleagues or partners, you simply have to click the “Share” button and choose how to share your report, whether through a link or by entering an email address. You may also set whether the person gets the right to edit the report or merely view it.

How The Data Studio Affiliate Conversion And Traffic Data Integration Works
To integrate all your affiliate conversion data in Data Studio, we first need to collect your sales and leads data from your affiliate network accounts. We do this by using the affiliate networks’ API endpoints. So, all you need to do is provide us with your network accounts’ API credentials, and we will be able to gather your data.
We will then process your data, place it in one uniform database which we can then connect to Data Studio.
We also offer a sale-to-click attribution feature, with which you can identify from which traffic sources, campaigns, landing pages, and websites your conversions were generated. Once we match the data, we can integrate it as a separate data set in Data Studio, giving you access to all your session, click, and conversion data connected with one another.
How To Integrate Your Affiliate Conversion Data In Data Studio
To integrate your affiliate conversions in Data Studio, you will only need to follow a few steps. However, if you want your affiliate sale and lead data attributed to your traffic data, you will need to follow an additional step.
These are the steps to get started:
- Create a wecantrack account
- Connect your affiliate networks to our system
- Activate the Data Studio Integration feature
If you want to have your conversion data attributed to traffic data as well, then you need to follow the next step as well:
Once you have activated the Data Studio Integration feature, we will approach you with a dashboard template that contains your data set.
Additional Tips On Working With Data Studio
Creating New Fields
Data Studio offers a wide range of functions with which you can create new fields to adjust or filter your data. There is a list of functions available on the Data Studio Help page, click on the following button to get there.
To create a new field:
- Go to Resources > Manage added data sources
- Click on the ‘Edit’ button of the relevant data set
- Click on + Add a new field (on the right)
You can for example use functions to create separate fields for pending, approved or declined commission, which will enable you to place them in separate columns next to each other in a table.
With our dataset the following formula can be used to filter out declined commission:
case when status = ‘declined’ then commission_amount else 0 end
Once this field was successfully created, you can select it when editing your tables and graphs.
In our Data Studio Integration guide you can find additional information regarding available fields and helpful formulas.
